
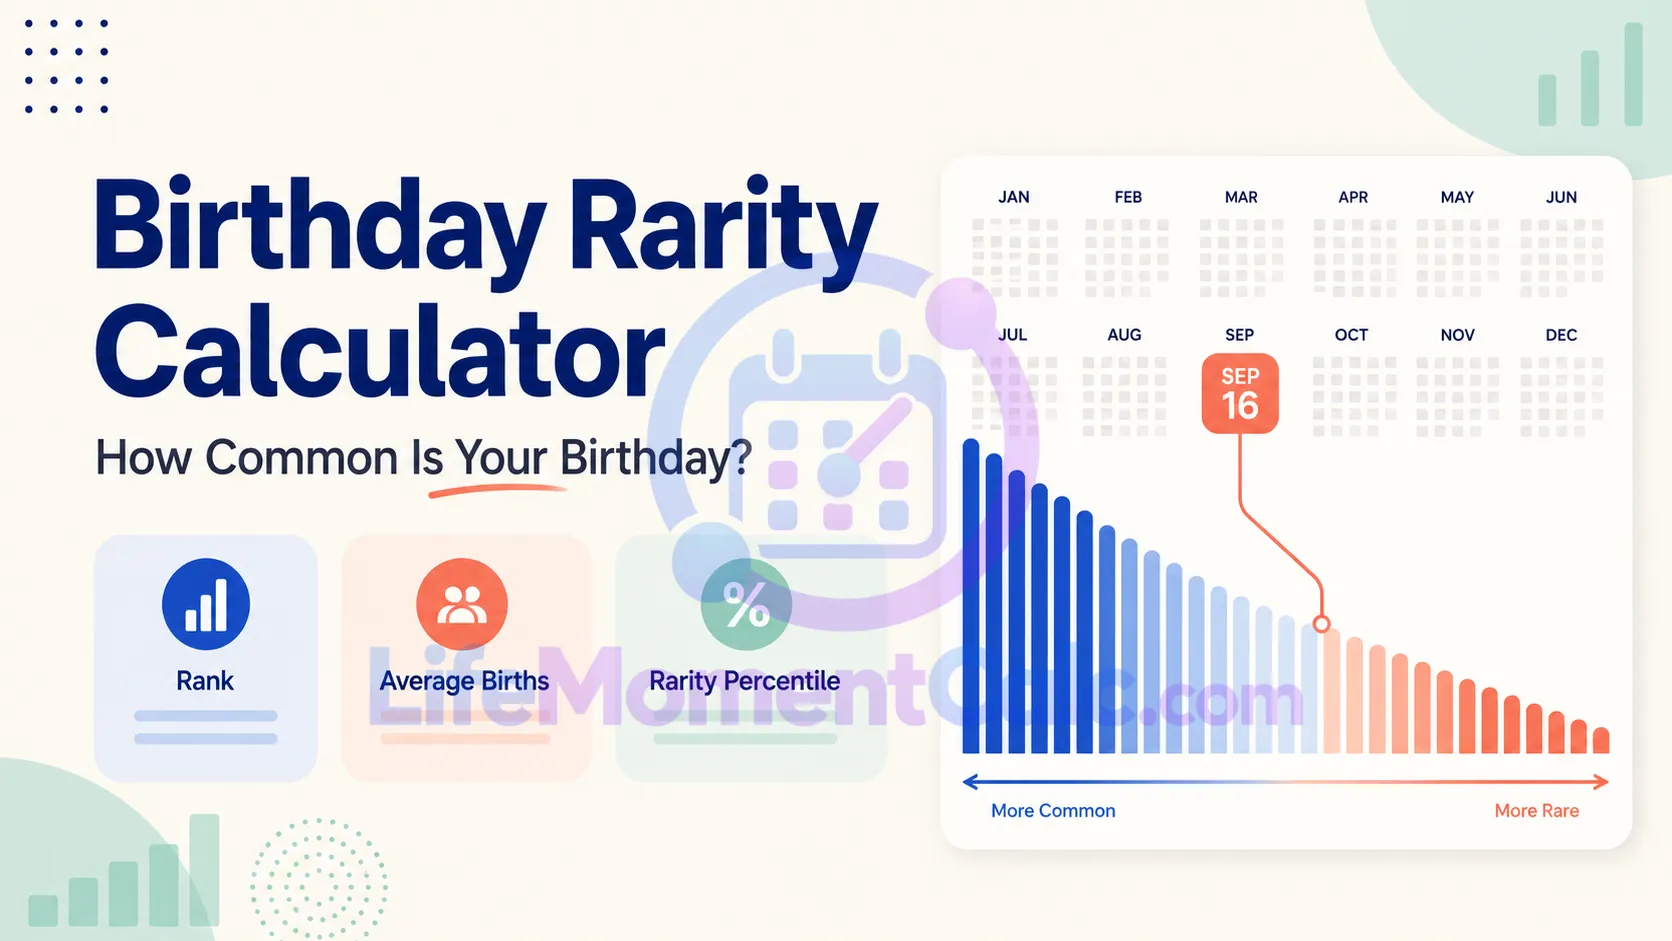
Some birthdays appear more frequently in historical records than others. The Birthday Rarity Calculator compares a selected month and day with an embedded dataset covering 21 years of United States daily birth counts.
Instead of returning a vague “rare” label, the tool reports the average number of births, ranking in both directions, rarity percentile, and percentage difference from the overall daily average. It also explains the special treatment required for February 29.
Compare a month and day with 21 years of U.S. daily birth counts, including rank, average births, percentile, and dataset context. The embedded table combines CDC/NCHS daily counts for 1994–1999 with Social Security Administration daily counts for 2000–2014, matching the public FiveThirtyEight births dataset methodology. Each calendar date is averaged across years when that date occurred and ranked from most common to least common. This is a historical U.S. frequency comparison, not a worldwide probability or a prediction for a different era. February 29 receives a per-occurrence average and also gets a separate calendar-frequency note because it does not occur every year.Birthday Rarity Calculator
U.S. birthday frequency
Dataset
What “rare” means here
Check a Month and Day Combination
Choose a birth month, enter the day, and select Check birthday frequency. A year is not required because the comparison groups records by recurring calendar date.
The calculator validates the combination before searching. It accepts February 29 because the dataset contains leap year observations, but rejects impossible dates such as April 31.
The result summarizes how the selected date compares with all 366 possible month and day combinations. Rank 1 means the highest average birth frequency in this historical dataset, not the rarest date.
Dataset and Formulas Used by the Tool
The embedded table combines nonoverlapping U.S. daily birth totals for 1994 to 2014. Counts for 1994 to 1999 originate from CDC/NCHS data, while the 2000 to 2014 portion uses Social Security Administration daily counts included in the public dataset methodology.
For an ordinary date:
Average births for date = total births recorded on that date ÷ 21
February 29 occurred five times during the period, so its average per occurrence is:
February 29 average = total February 29 births ÷ 5
All 366 averages are sorted from highest to lowest. The selected date’s first position in that sorted list becomes its most common rank.
Rank from rarest = 367 − rank from most common
The tool converts rank into a rarity percentile:
Rarity percentile = (most common rank − 1) ÷ 365 × 100
It also calculates how far the date sits above or below the mean of all date averages:
Difference = (selected date average ÷ all date mean − 1) × 100
These formulas describe the embedded historical dataset. They do not calculate a universal probability of being born on that date.
Reading the Ranking Correctly
A date ranked near 1 was among the more frequent birthdays in the 1994 to 2014 U.S. records. A rank closer to 366 indicates a lower average frequency.
The “rank from rarest” reverses the perspective. A date with rarest rank 1 has the lowest average; a large rarest rank means it was relatively common.
The rarity percentile increases as the date moves toward the less common end. It provides a quick comparison but should be read alongside the average birth count and dataset notice. Small differences in rank do not necessarily represent meaningful real world differences.
Why Birthday Frequencies Differ
Birth patterns can be influenced by many factors, including scheduled deliveries, holidays, seasonal conception patterns, healthcare practices, reporting systems, and changes across time. This calculator does not attempt to identify the cause behind a date’s position.
The dataset is also historical. A date’s rank for another country, generation, or period could be different. The result should therefore be described as a historical U.S. comparison rather than a statement that a birthday is globally rare.
If you are planning an informal celebration around date based milestones, the Golden, Platinum & Diamond Birthday Tool can calculate several birthday conventions on one timeline.
The February 29 Difference
Leap day needs two separate interpretations. The displayed average answers: “How many births occurred on February 29 when that date existed?” It does not answer: “How often does February 29 appear on the calendar?”
In the Gregorian cycle, February 29 occurs 97 times across 400 years, or approximately once per 1,461 calendar days. A person born on February 29 therefore has an uncommon calendar date even though the number of births during an actual leap day may not be the lowest average per occurrence.
Keeping those concepts separate prevents the leap day result from becoming misleading.
Appropriate Ways to Use This Result
The Birthday Rarity Calculator works well for personal curiosity, birthday pages, classroom data discussions, trivia, and comparing dates within one defined dataset.
It should not be used to infer personality, health, family background, socioeconomic status, or future outcomes. Frequency does not make one birthday better or more meaningful than another.
Avoid rewriting the result as “only this many people share your birthday.” The average shown represents births per occurrence during the covered U.S. period, not the number of living people with that birthday today.
Birthday Rarity Questions
What is the rarest birthday?
The calculator identifies the lowest frequency date within its specific dataset. Results should not be generalized to every country or modern year.
Are holidays usually less common?
Some holidays may have lower recorded averages, partly because planned medical procedures can be scheduled differently. The calculator reports the observed comparison but does not prove why it occurred.
Does the birth year affect the result?
No. This tool compares the recurring month and day across the entire covered period. It does not provide a specific birthday frequency for each year.
Why are there 366 rankings?
February 29 is included as a valid calendar date category, giving the comparison 366 possible dates.